Ob and Yenisei plumes in the Kara Sea

Optical measurements from the 2005–2011 ice-free seasons used to characterise the buoyant plume formed by Ob and Yenisei discharge in the southern Kara Sea

Published figures

Interpolated campaign fields, reproduced in their original published form.

Regional composite

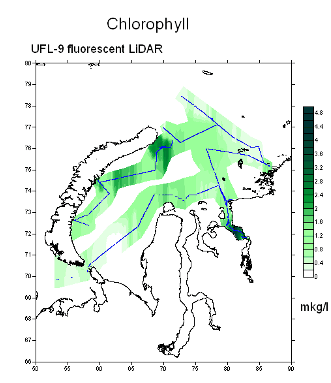
Interpolated chlorophyll a field mapped along the lidar track, Kara Sea, Regional composite
Fig. 1Chlorophyll a
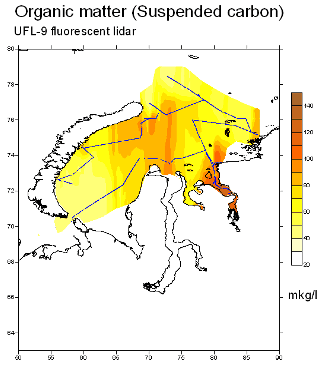
Interpolated suspended organic carbon field mapped along the lidar track, Kara Sea, Regional composite
Fig. 2Organic matter, suspended carbon
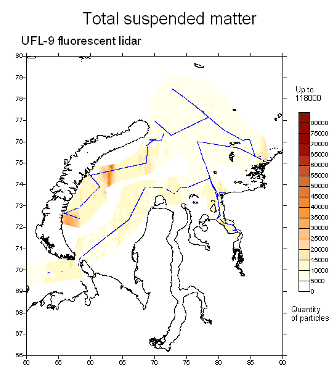
Interpolated particle count field mapped along the lidar track, Kara Sea, Regional composite
Fig. 3Particle count

July 2016

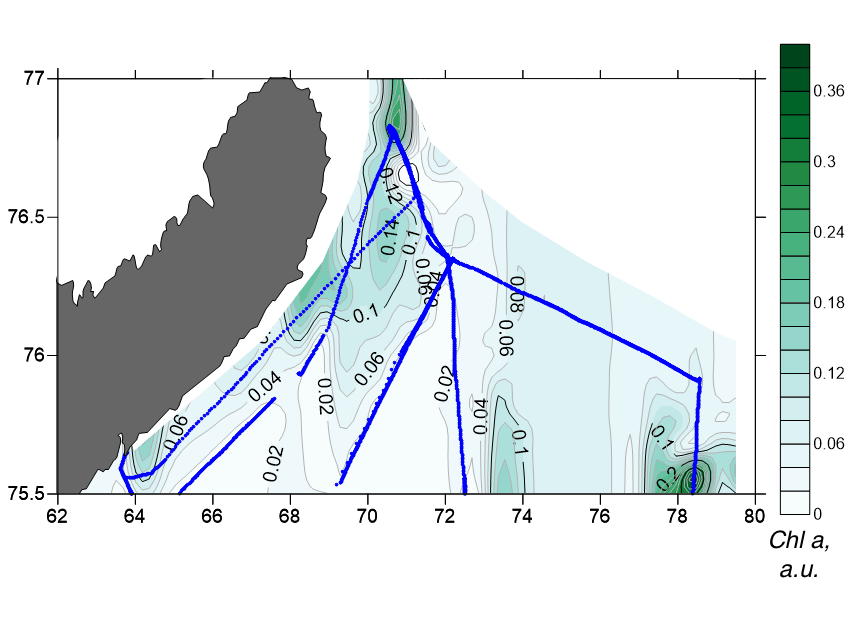
Interpolated chlorophyll a field mapped along the lidar track, Kara Sea, July 2016
Fig. 4Chlorophyll a
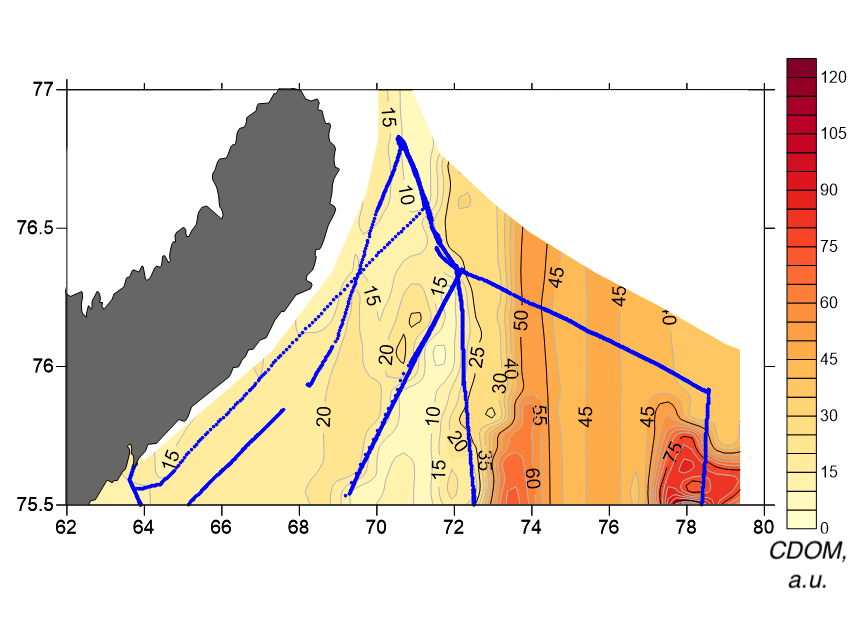
Interpolated CDOM field mapped along the lidar track, Kara Sea, July 2016
Fig. 5CDOM
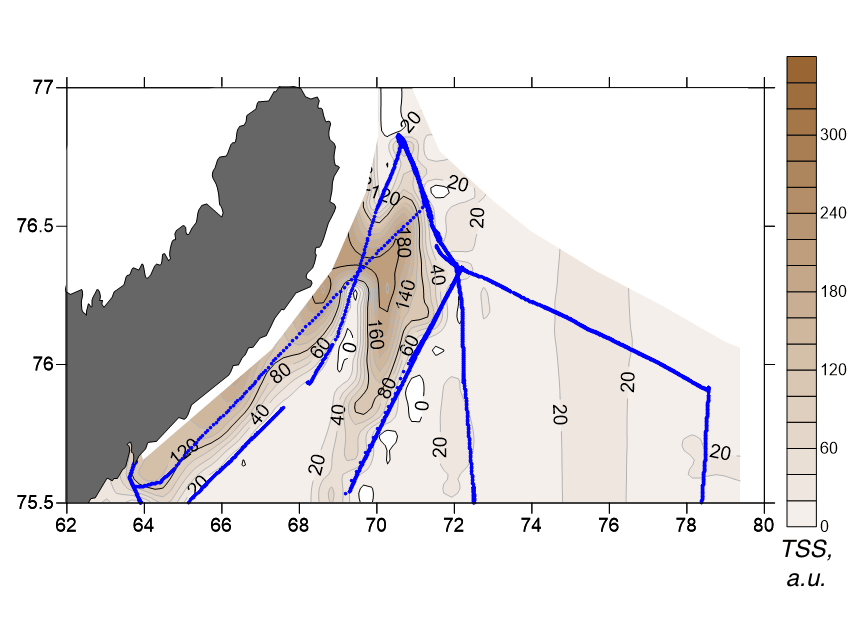
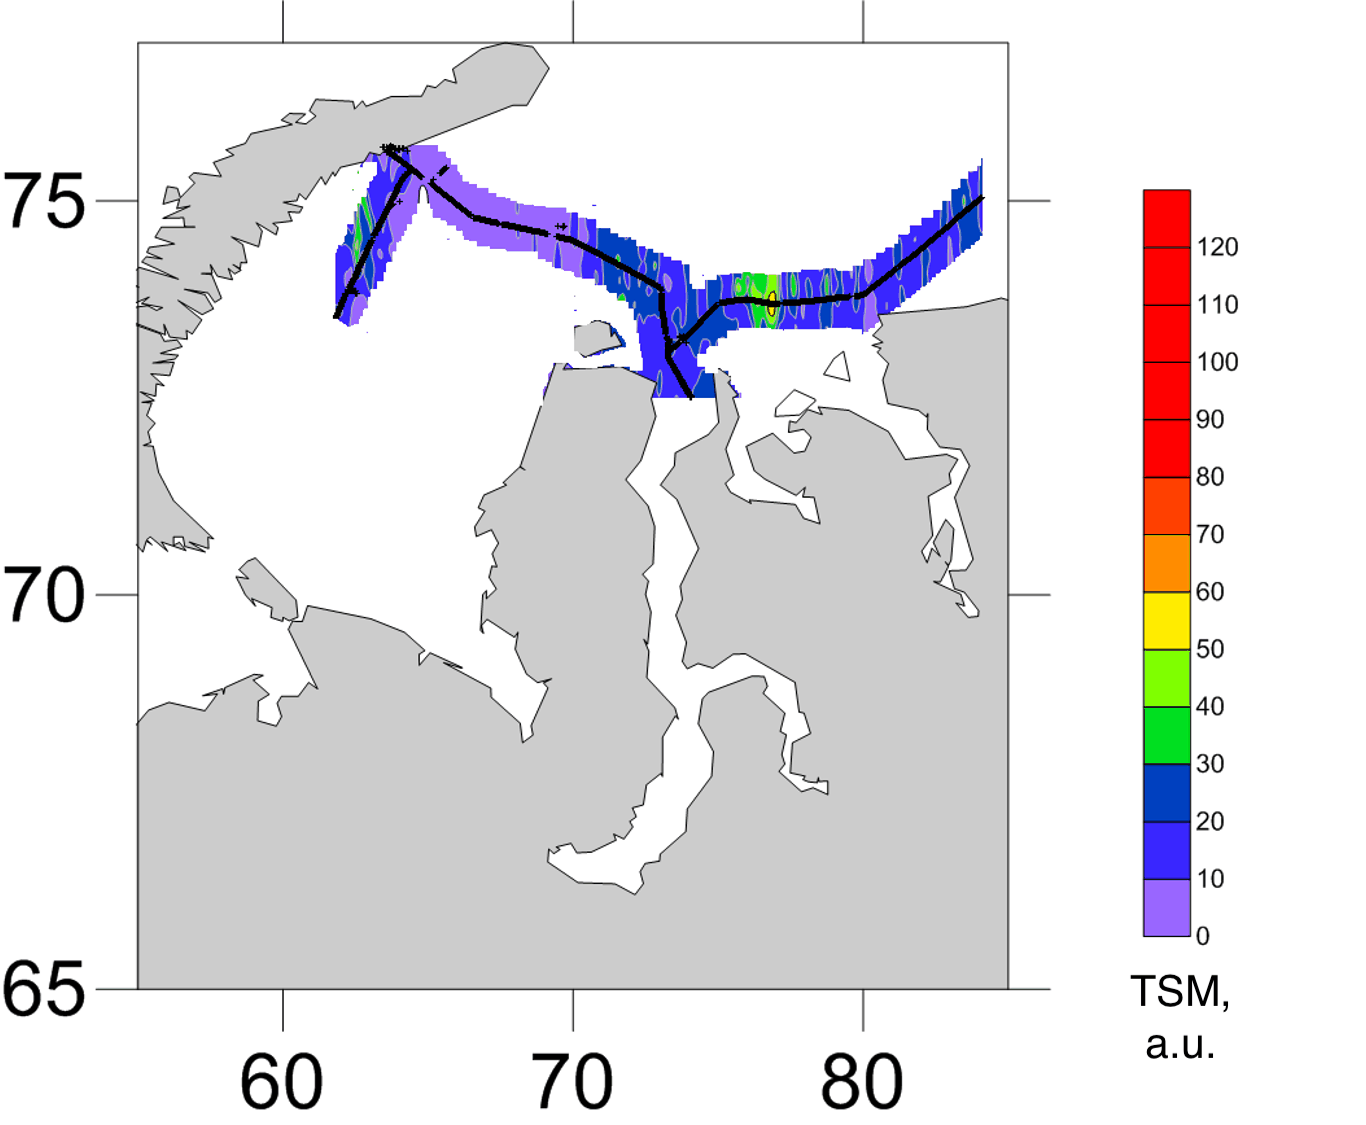
Interpolated total suspended matter field mapped along the lidar track, Kara Sea, July 2016
Fig. 6TSM

September 2017

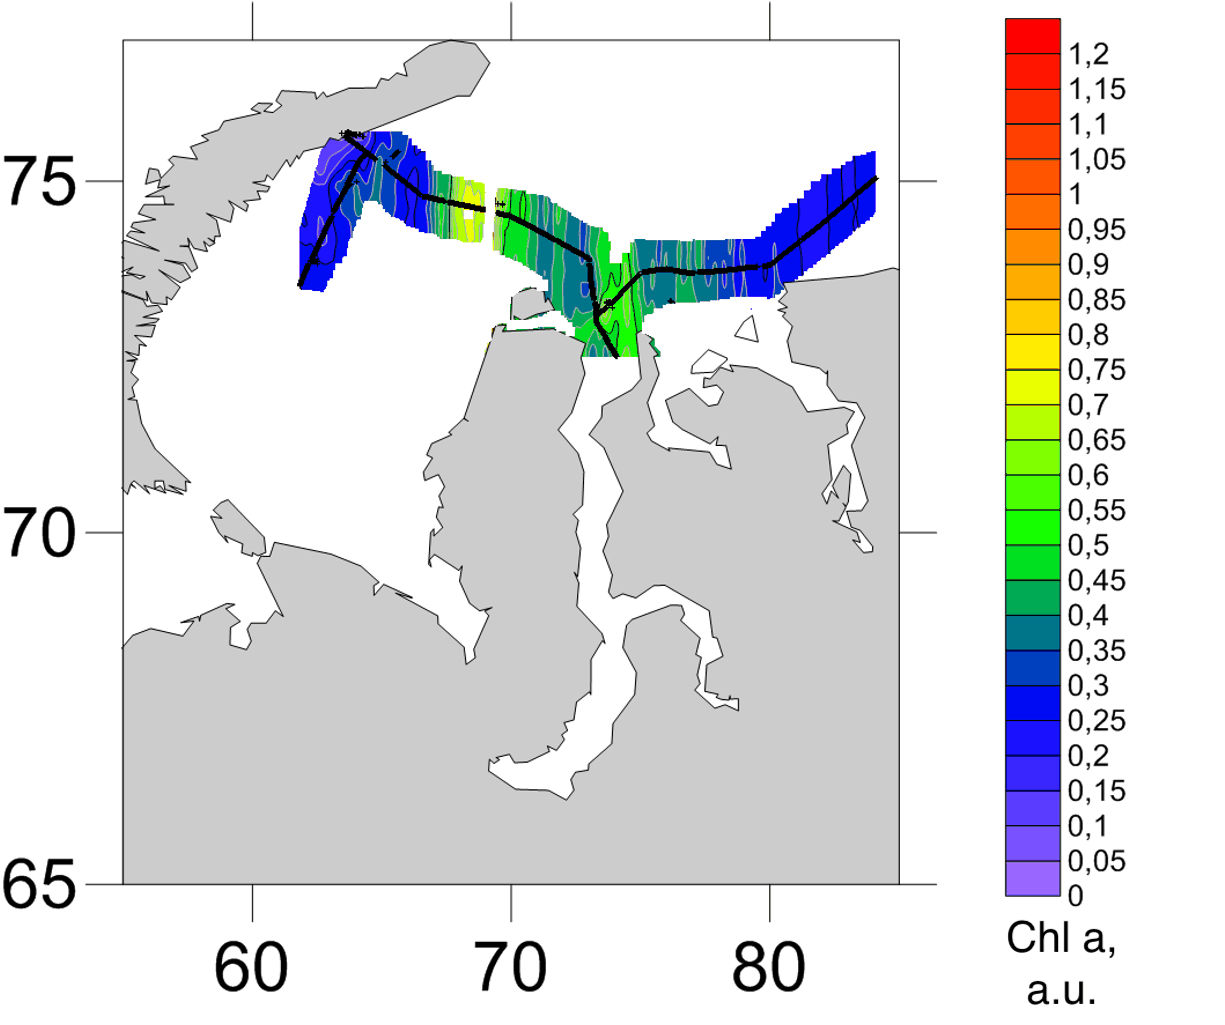
Interpolated chlorophyll a field mapped along the lidar track, Kara Sea, September 2017
Fig. 7Chlorophyll a
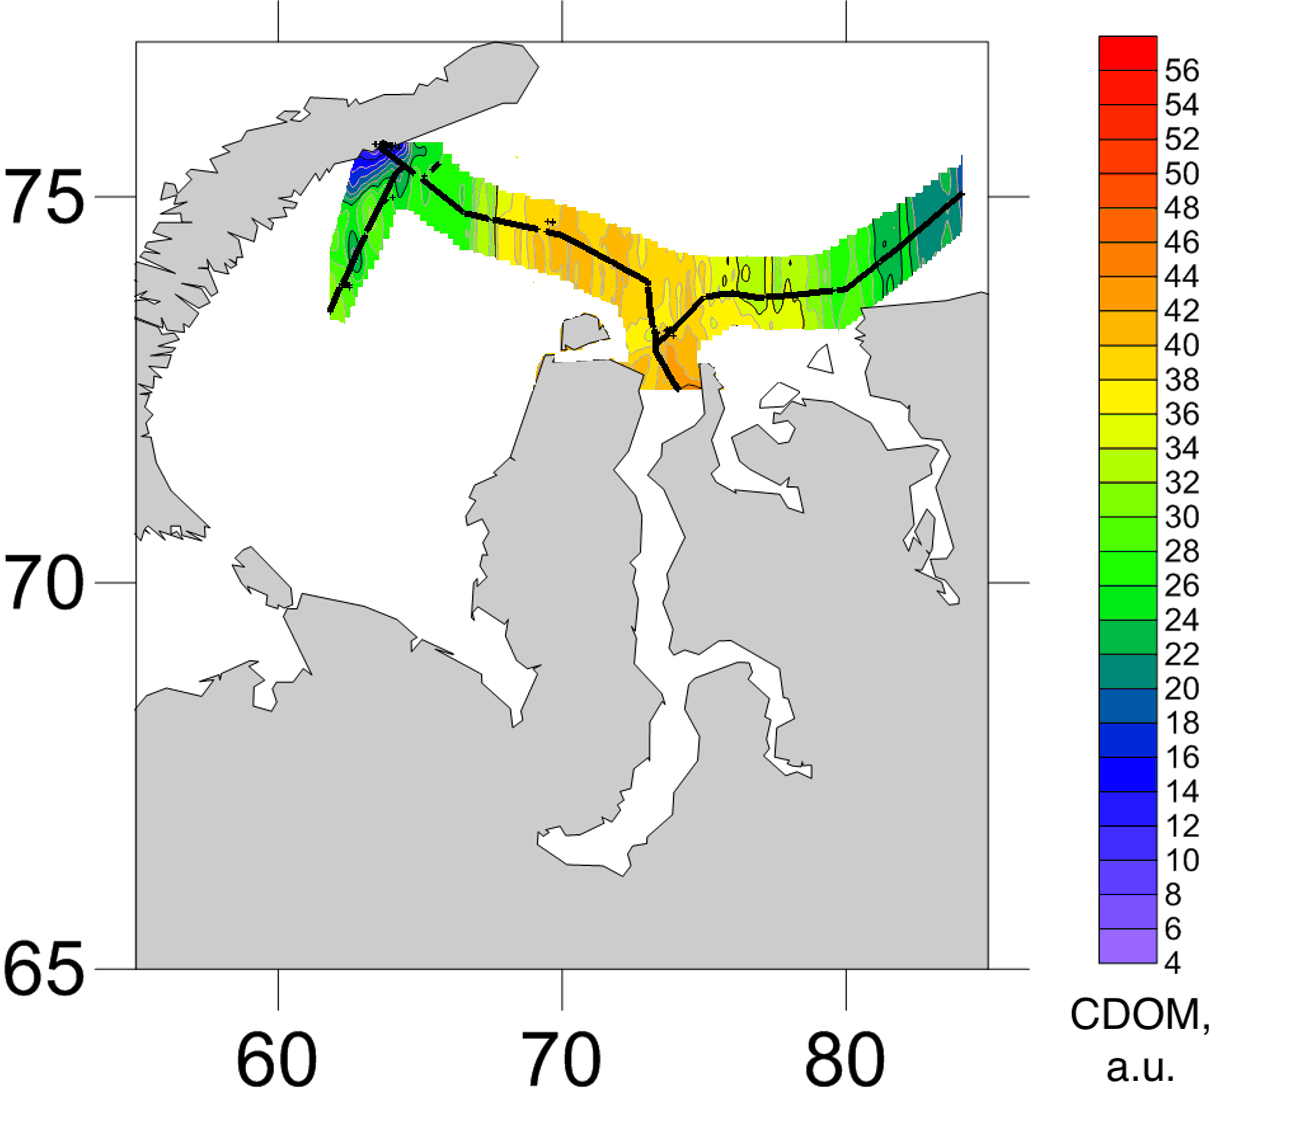
Interpolated CDOM field mapped along the lidar track, Kara Sea, September 2017
Fig. 8CDOM
Interpolated total suspended matter field mapped along the lidar track, Kara Sea, September 2017
Fig. 9TSM
Kara SeaArctic Ocean
50 km
● Kara Sea 2016, July, 2016-07-28 – 2016-07-30121,400 measurements IDW interpolation, 600 samples
Chl-a0.034.45µg/L
CDOM0.318.51a.u.
TSM0.8220.7mg/L

Fig. 10 Campaign measurement record. 121,400 lidar returns are plotted along the vessel track for Chl-a, CDOM, TSM. The field view applies inverse-distance weighting to the same observations; the shoreline is from Natural Earth.

During the ice-free seasons from 2005 to 2011, in-water optical measurements were collected across the buoyant plume formed by the Ob and Yenisei rivers in the southern Kara Sea.

The combined record showed a recurrent structure in which Yenisei-dominated water was separated from ambient sea water by a more saline Ob-influenced mass. High-resolution measurements, satellite imagery, and reanalysis were used to examine how frequently this arrangement occurred and how it varied. The study appeared in the Journal of Geophysical Research: Oceans in 2017.